[파이썬]캐글 타이타닉 데이터 탐색 #11(Feature Engineering)
11. Feature engineering - Change string to categorical and Pearson coefficient
df_train.Initial.unique()
array([2, 3, 1, 0, 4])
df_train['Initial'] = df_train['Initial'].map({'Master' : 0, 'Miss' : 1, 'Mr' : 2, 'Mrs' :3, 'Other' : 4 })
df_test['Initial'] = df_test['Initial'].map({'Master' : 0, 'Miss' : 1, 'Mr' : 2, 'Mrs' :3, 'Other' : 4 })
df_train['Embarked'] = df_train['Embarked'].map({'C' : 0, 'Q' : 1, 'S' : 2})
df_test['Embarked'] = df_test['Embarked'].map({'C' : 0, 'Q' : 1, 'S' : 2})
# Null Data가 없다.
df_train.Embarked.isnull().any()
False
df_train['Sex'].unique()
array(['male', 'female'], dtype=object)
df_train['Sex'] = df_train['Sex'].map({'female': 0, 'male' : 1})
df_test['Sex'] = df_test['Sex'].map({'female': 0, 'male' : 1})

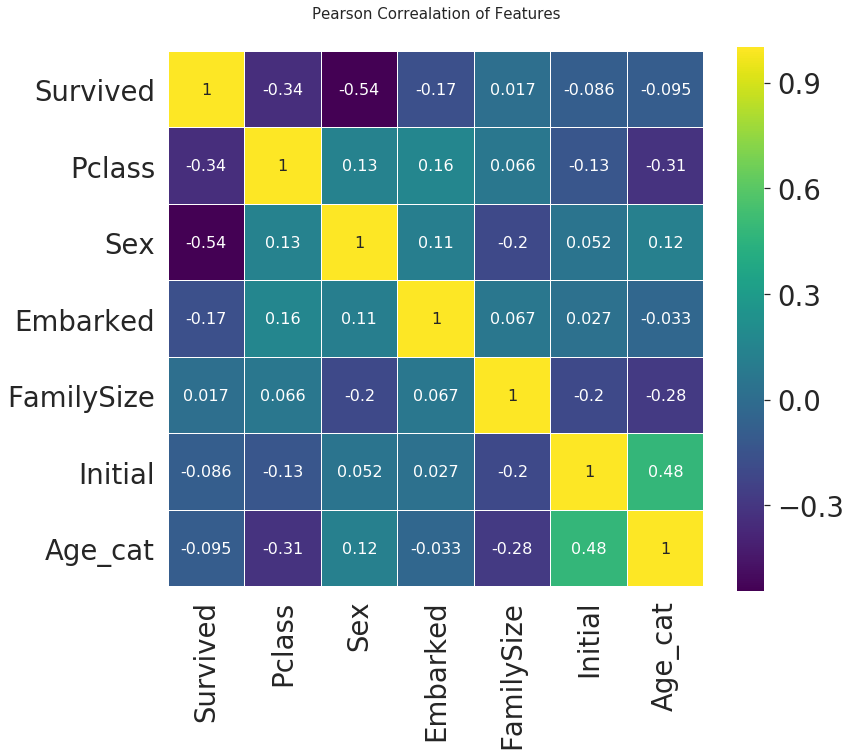
heatmap_data = df_train[['Survived', 'Pclass', 'Sex', 'Embarked', 'FamilySize', 'Initial', 'Age_cat']]
colormap = plt.cm.viridis
plt.figure(figsize=(12, 10))
plt.title('Pearson Correalation of Features', y=1.05, size=15)
sns.heatmap(heatmap_data.astype(float).corr(), linewidths=0.1, vmax=1.0,
           square=True, cmap=colormap, linecolor='white', annot=True, annot_kws = {'size': 16})
<matplotlib.axes._subplots.AxesSubplot at 0x7f2f0a079a58>

