[파이썬]캐글 타이타닉 데이터 탐색 #5, #6(Violinplot, EDA-Embarked)
캐글 타이타닉 데이터 탐색 #5, #6 (Violinplot, EDA-Embarked)
5번째 타이타닉 데이터 탐색 바이올린플랏과 6번째 Embarked를 EDA하려 한다.
참고 : You Han Lee 유튜브
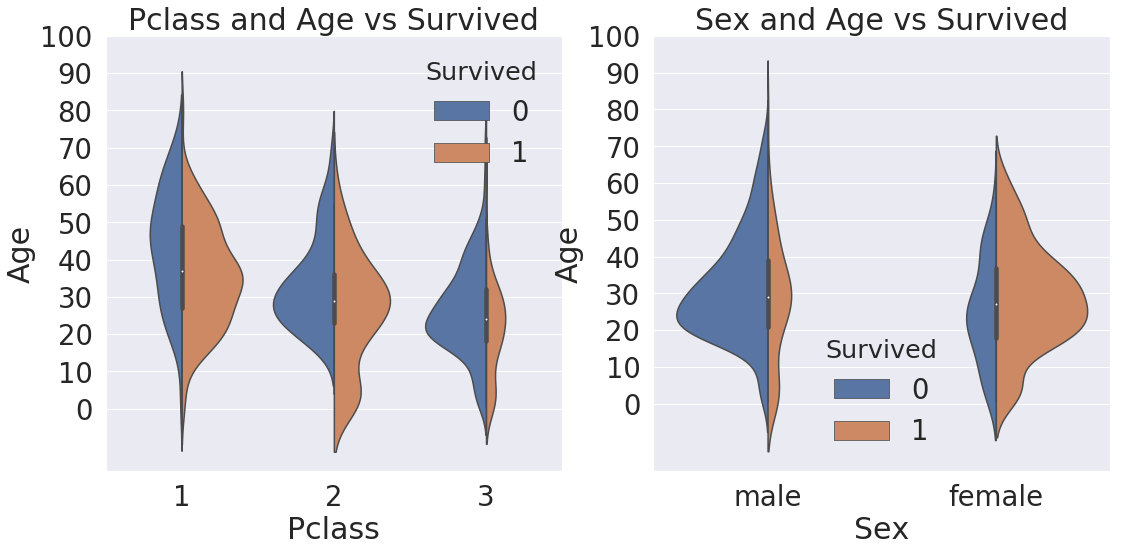
Pclass, Sex, Age
# 두개의 변수(Pclass, Age, Sex 중 2개)와  Survived와의 관계를 바이올린플랏으로 그림
f, ax = plt.subplots(1, 2, figsize=(18,8))
sns.violinplot('Pclass', 'Age', hue='Survived', data=df_train, scale='count', split=True, ax=ax[0])
ax[0].set_title('Pclass and Age vs Survived')
ax[0].set_yticks(range(0, 110, 10)) # y축을 0 ~ 110 까지 10씩

sns.violinplot('Sex', 'Age', hue='Survived', data=df_train, scale='count', split=True, ax=ax[1])
ax[1].set_title('Sex and Age vs Survived')
ax[1].set_yticks(range(0, 110, 10))
plt.show()
Embarked
f, ax = plt.subplots(1, 1, figsize=(7, 7))
df_train[['Embarked', 'Survived']].groupby(['Embarked'], as_index=True).mean().sort_values(by='Survived', ascending=False).plot.bar(ax=ax)
<matplotlib.axes._subplots.AxesSubplot at 0x7f49dd64ce10>
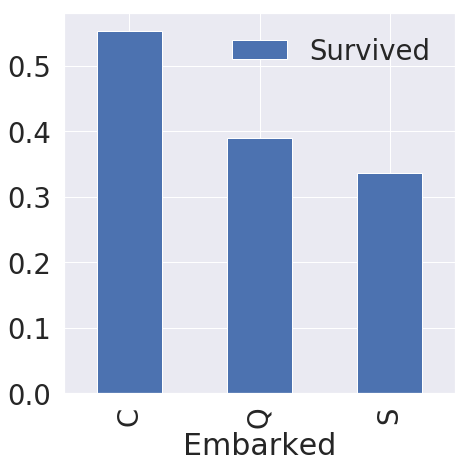
# 솔팅하는 법
df_train[['Embarked', 'Survived']].groupby(['Embarked'], as_index=True).mean().sort_values(by='Survived')
| Survived | |
|---|---|
| Embarked | |
| S | 0.336957 |
| Q | 0.389610 |
| C | 0.553571 |
# 인덱스 영어순 솔팅
df_train[['Embarked', 'Survived']].groupby(['Embarked'], as_index=True).mean().sort_index()
| Survived | |
|---|---|
| Embarked | |
| C | 0.553571 |
| Q | 0.389610 |
| S | 0.336957 |
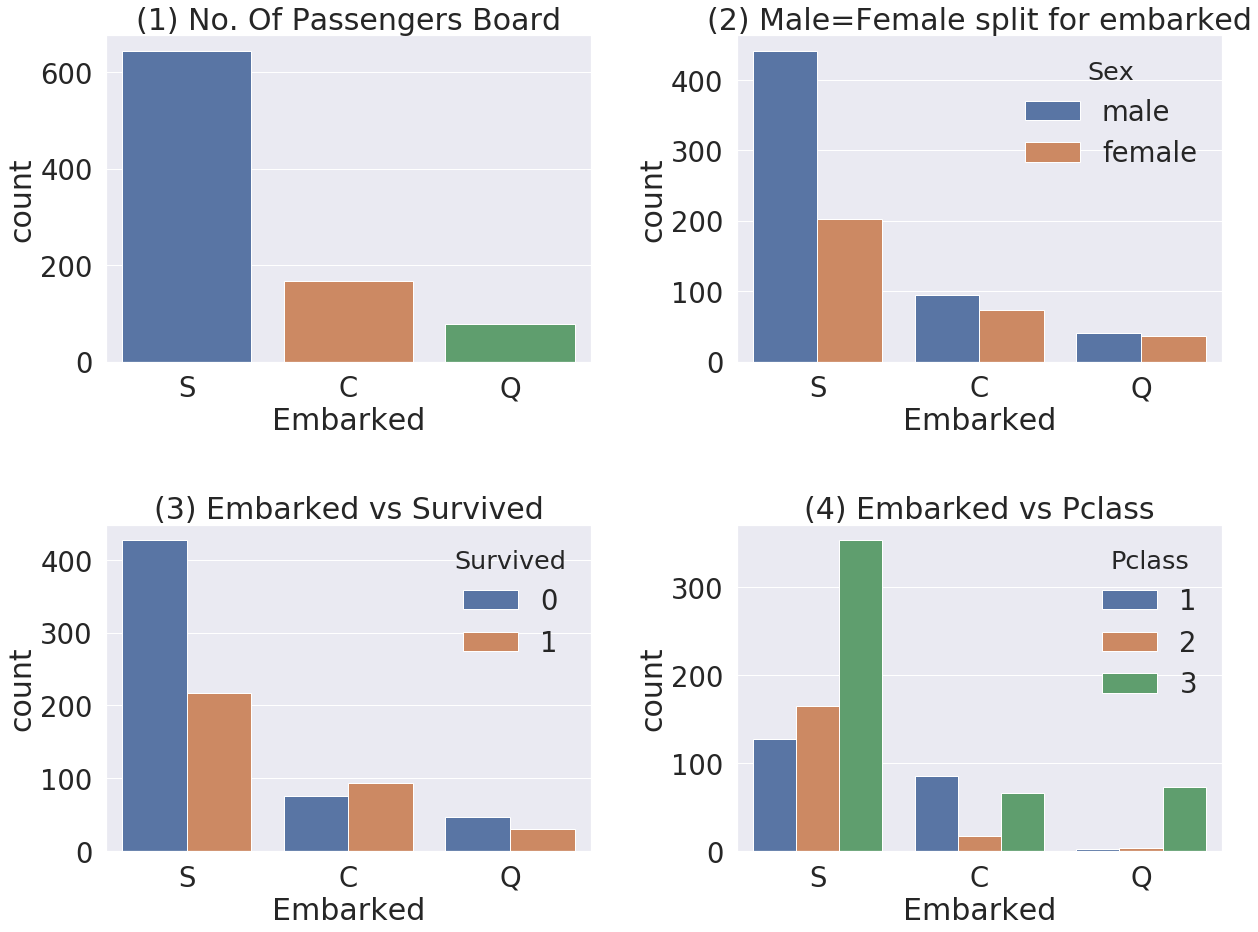
f, ax = plt.subplots(2, 2, figsize=(20, 15))
sns.countplot('Embarked', data=df_train, ax=ax[0, 0])
ax[0, 0].set_title('(1) No. Of Passengers Board')

sns.countplot('Embarked', hue='Sex', data=df_train, ax=ax[0, 1])
ax[0, 1].set_title('(2) Male=Female split for embarked')

sns.countplot('Embarked', hue='Survived', data=df_train, ax=ax[1,0])
ax[1, 0].set_title('(3) Embarked vs Survived')

sns.countplot('Embarked', hue='Pclass', data=df_train, ax=ax[1, 1])
ax[1, 1].set_title('(4) Embarked vs Pclass')

plt.subplots_adjust(wspace=0.3, hspace=0.5) # 그래프간 간격 주기
plt.show()