[파이썬]캐글 타이타닉 데이터 탐색 #3(성별)
캐글 타이타닉 데이터 탐색 #3 (성별)
3번째 타이타닉 데이터 탐색을 해보려한다.
참고 : You Han Lee 유튜브
2.2 Sex (성별))
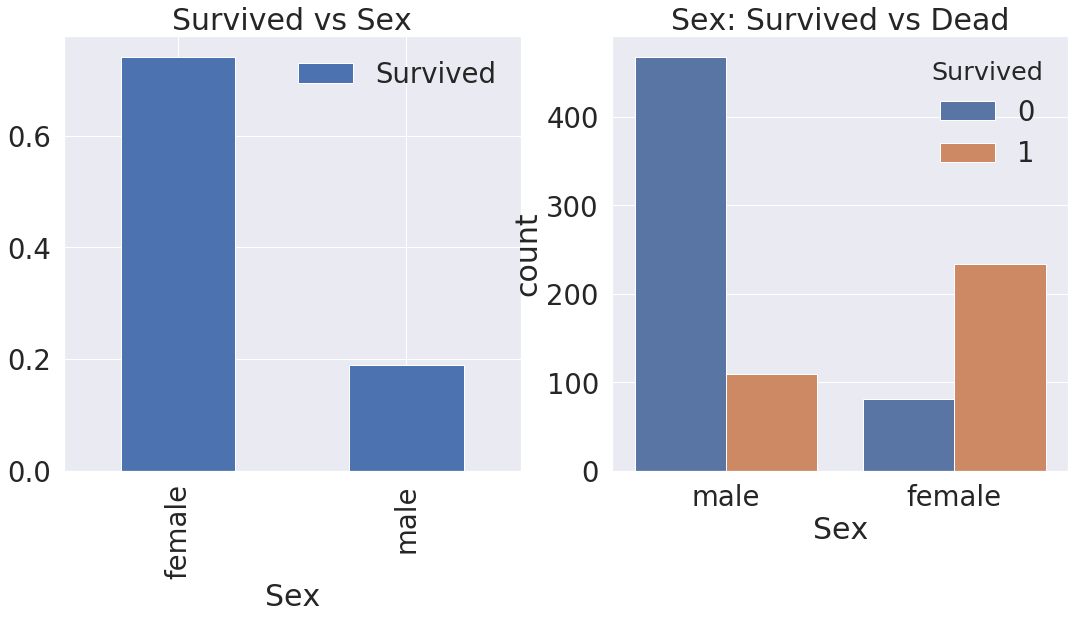
f, ax = plt.subplots(1, 2, figsize=(18,8))
df_train[['Sex', 'Survived']].groupby(['Sex'], as_index=True).mean().plot.bar(ax=ax[0])
ax[0].set_title('Survived vs Sex')
sns.countplot('Sex', hue='Survived', data=df_train, ax=ax[1])
ax[1].set_title('Sex: Survived vs Dead')
plt.show()
df_train[['Sex', 'Survived']].groupby(['Sex'], as_index=True).mean().plot.bar()
<matplotlib.axes._subplots.AxesSubplot at 0x7f50c6b77198>
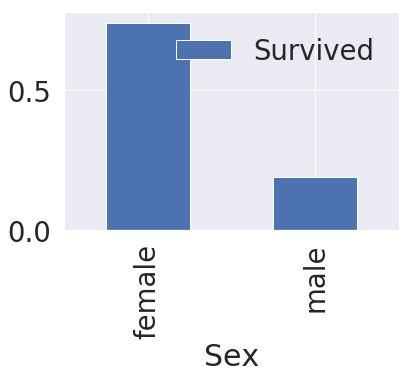
df_train[['Sex', 'Survived']].groupby(['Sex'], as_index=False).mean()
| Sex | Survived | |
|---|---|---|
| 0 | female | 0.742038 |
| 1 | male | 0.188908 |
pd.crosstab(df_train['Sex'], df_train['Survived'], margins=True).style.background_gradient(cmap='summer_r')
| Survived | 0 | 1 | All |
|---|---|---|---|
| Sex | |||
| female | 81 | 233 | 314 |
| male | 468 | 109 | 577 |
| All | 549 | 342 | 891 |
2.2 Both Sex and Pclass
sns.factorplot('Pclass', 'Survived', hue='Sex', data=df_train, size=6, aspect=1.5)
<seaborn.axisgrid.FacetGrid at 0x7f50c6b409e8>
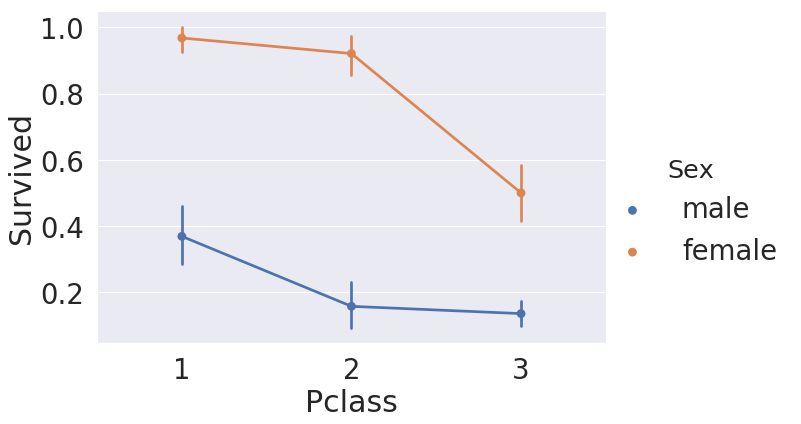
- Lady first.
- Money brings survival?
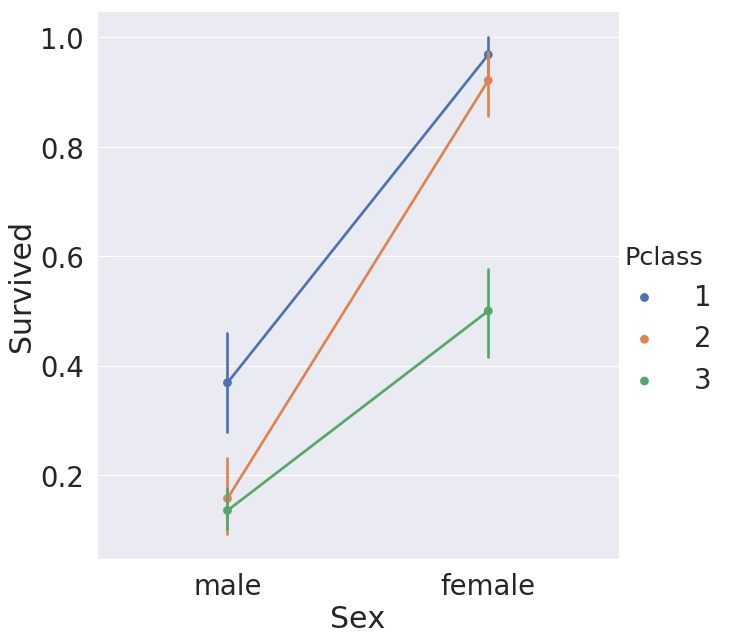
sns.factorplot(x='Sex', y='Survived', hue='Pclass', data=df_train, saturation=5,
              size=9, aspect=1)
<seaborn.axisgrid.FacetGrid at 0x7f50c6ccd048>